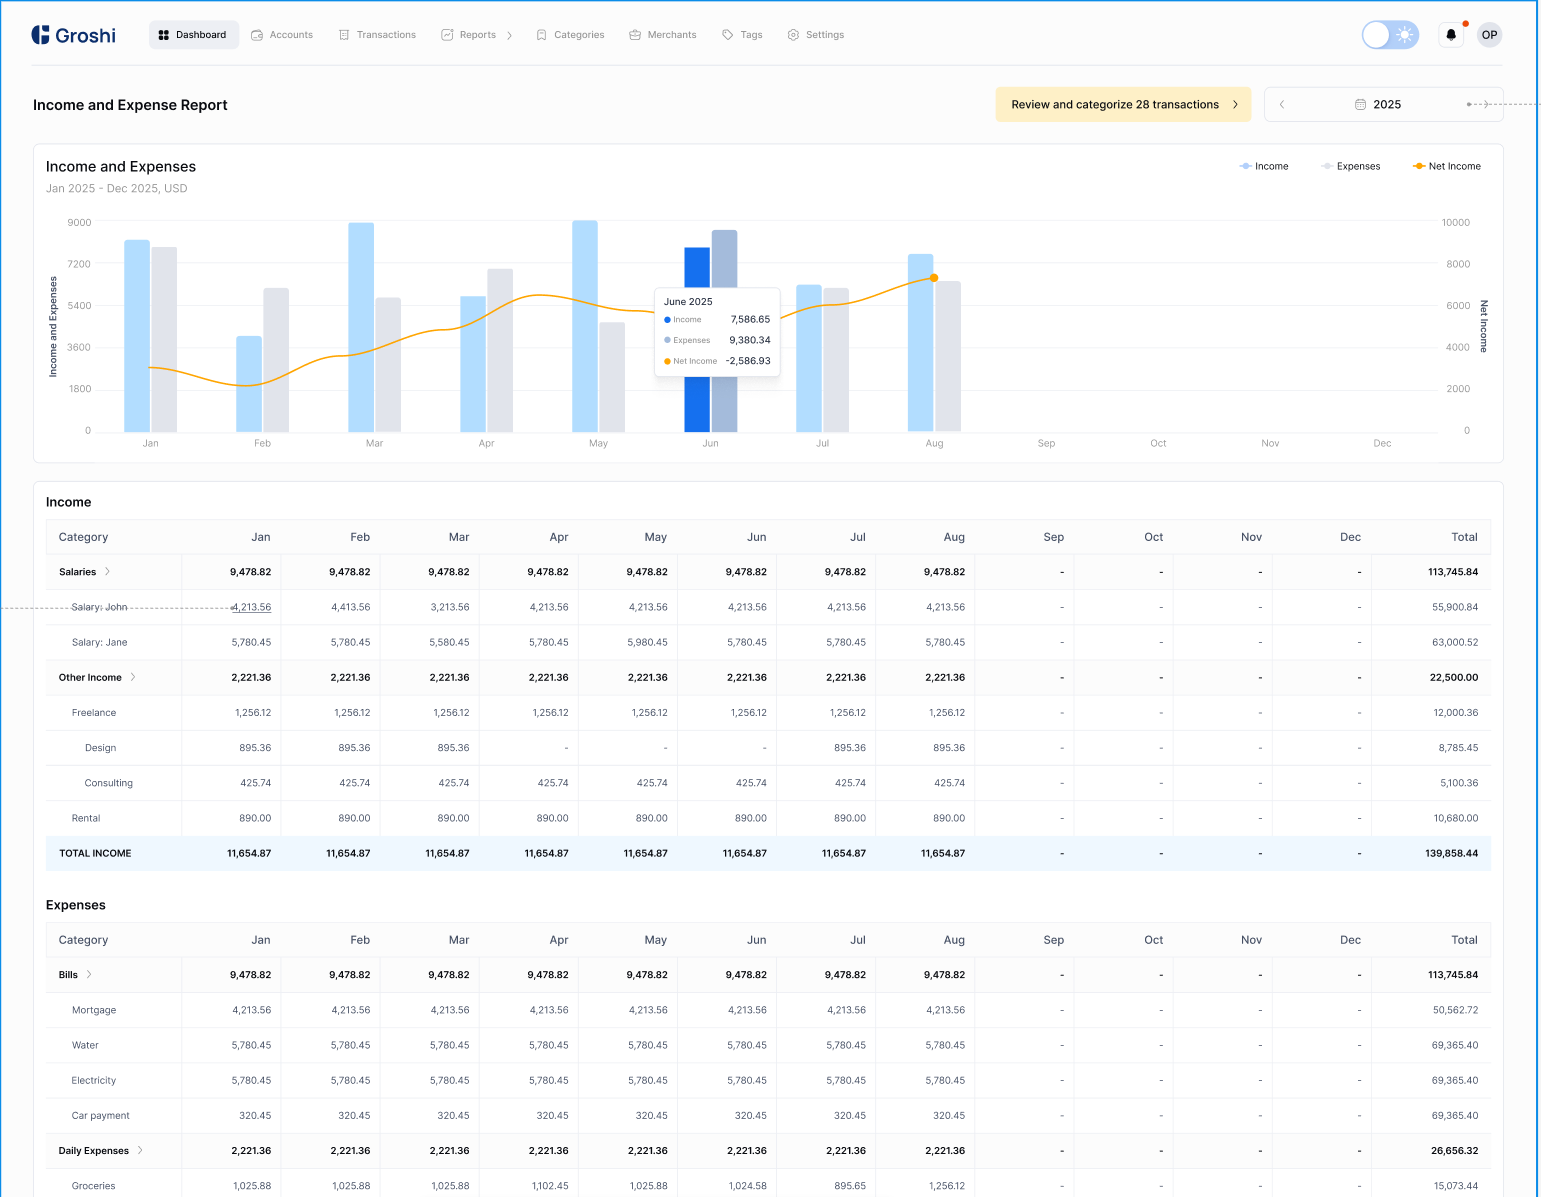
Income and Expense Report
We’ve redesigned our annual income and expense report.
On the chart, you can quickly see your earnings, spending, and net income for each month in a year.
Below, there’s a table showing your income and expenses in each category for each month. If you click on a number, a list of transactions will open showing transactions for that month in that category.
This is a great way to quickly analyze your income and expenses for the whole year.
Please authenticate to join the conversation.
Upvoters
Status
Completed
Board
💡 Feature Request
Date
6 months ago
Author

Alex
Subscribe to post
Get notified by email when there are changes.
Upvoters
Status
Completed
Board
💡 Feature Request
Date
6 months ago
Author
Alex
Subscribe to post
Get notified by email when there are changes.